
Shift-Left Distributed Observability
When running multiple microservices locally natively or via devx.yaml, figuring out where a request failed often requires tailing multiple sets of logs. Full distributed tracing is traditionally reserved for cloud/production environments due to the friction of setting up an OTLP collector and trace backends locally.
devx brings observability to your local environment with zero configuration.
Architecture & Execution Flow
Below are the architectural component structure and the step-by-step execution flow of Shift-Left Distributed Observability.
Component Diagram (C4 Level 2)
Execution Lifecycle Flowchart
Spawning a Trace Backend
You can instantly spin up a lightweight OpenTelemetry backend locally:
# Default: runs the lightweight jaegertracing/all-in-one backend
devx trace spawn

# Or use the full Grafana LGTM (Loki, Grafana, Tempo, Mimir) stack
devx trace spawn grafana
Data Persistence
Trace data is ephemeral by default, meaning deleting the container loses your traces. If you are comparing performance over time or doing benchmarking, you can persist the data locally:
devx trace spawn grafana --persistThis ensures trace data is durably stored in ~/.devx/telemetry/<engine>/ even across container restarts.
Automatic Environment Injection
devx automatically maps the correct endpoints. Whenever a trace backend is running, devx shell and any managed containers will automatically have the OTEL_EXPORTER_OTLP_ENDPOINT environment variable injected.
This means standard OpenTelemetry SDKs running in your applications will beam traces directly to your local backend out-of-the-box, without editing your .env files.
Visualizing Traces
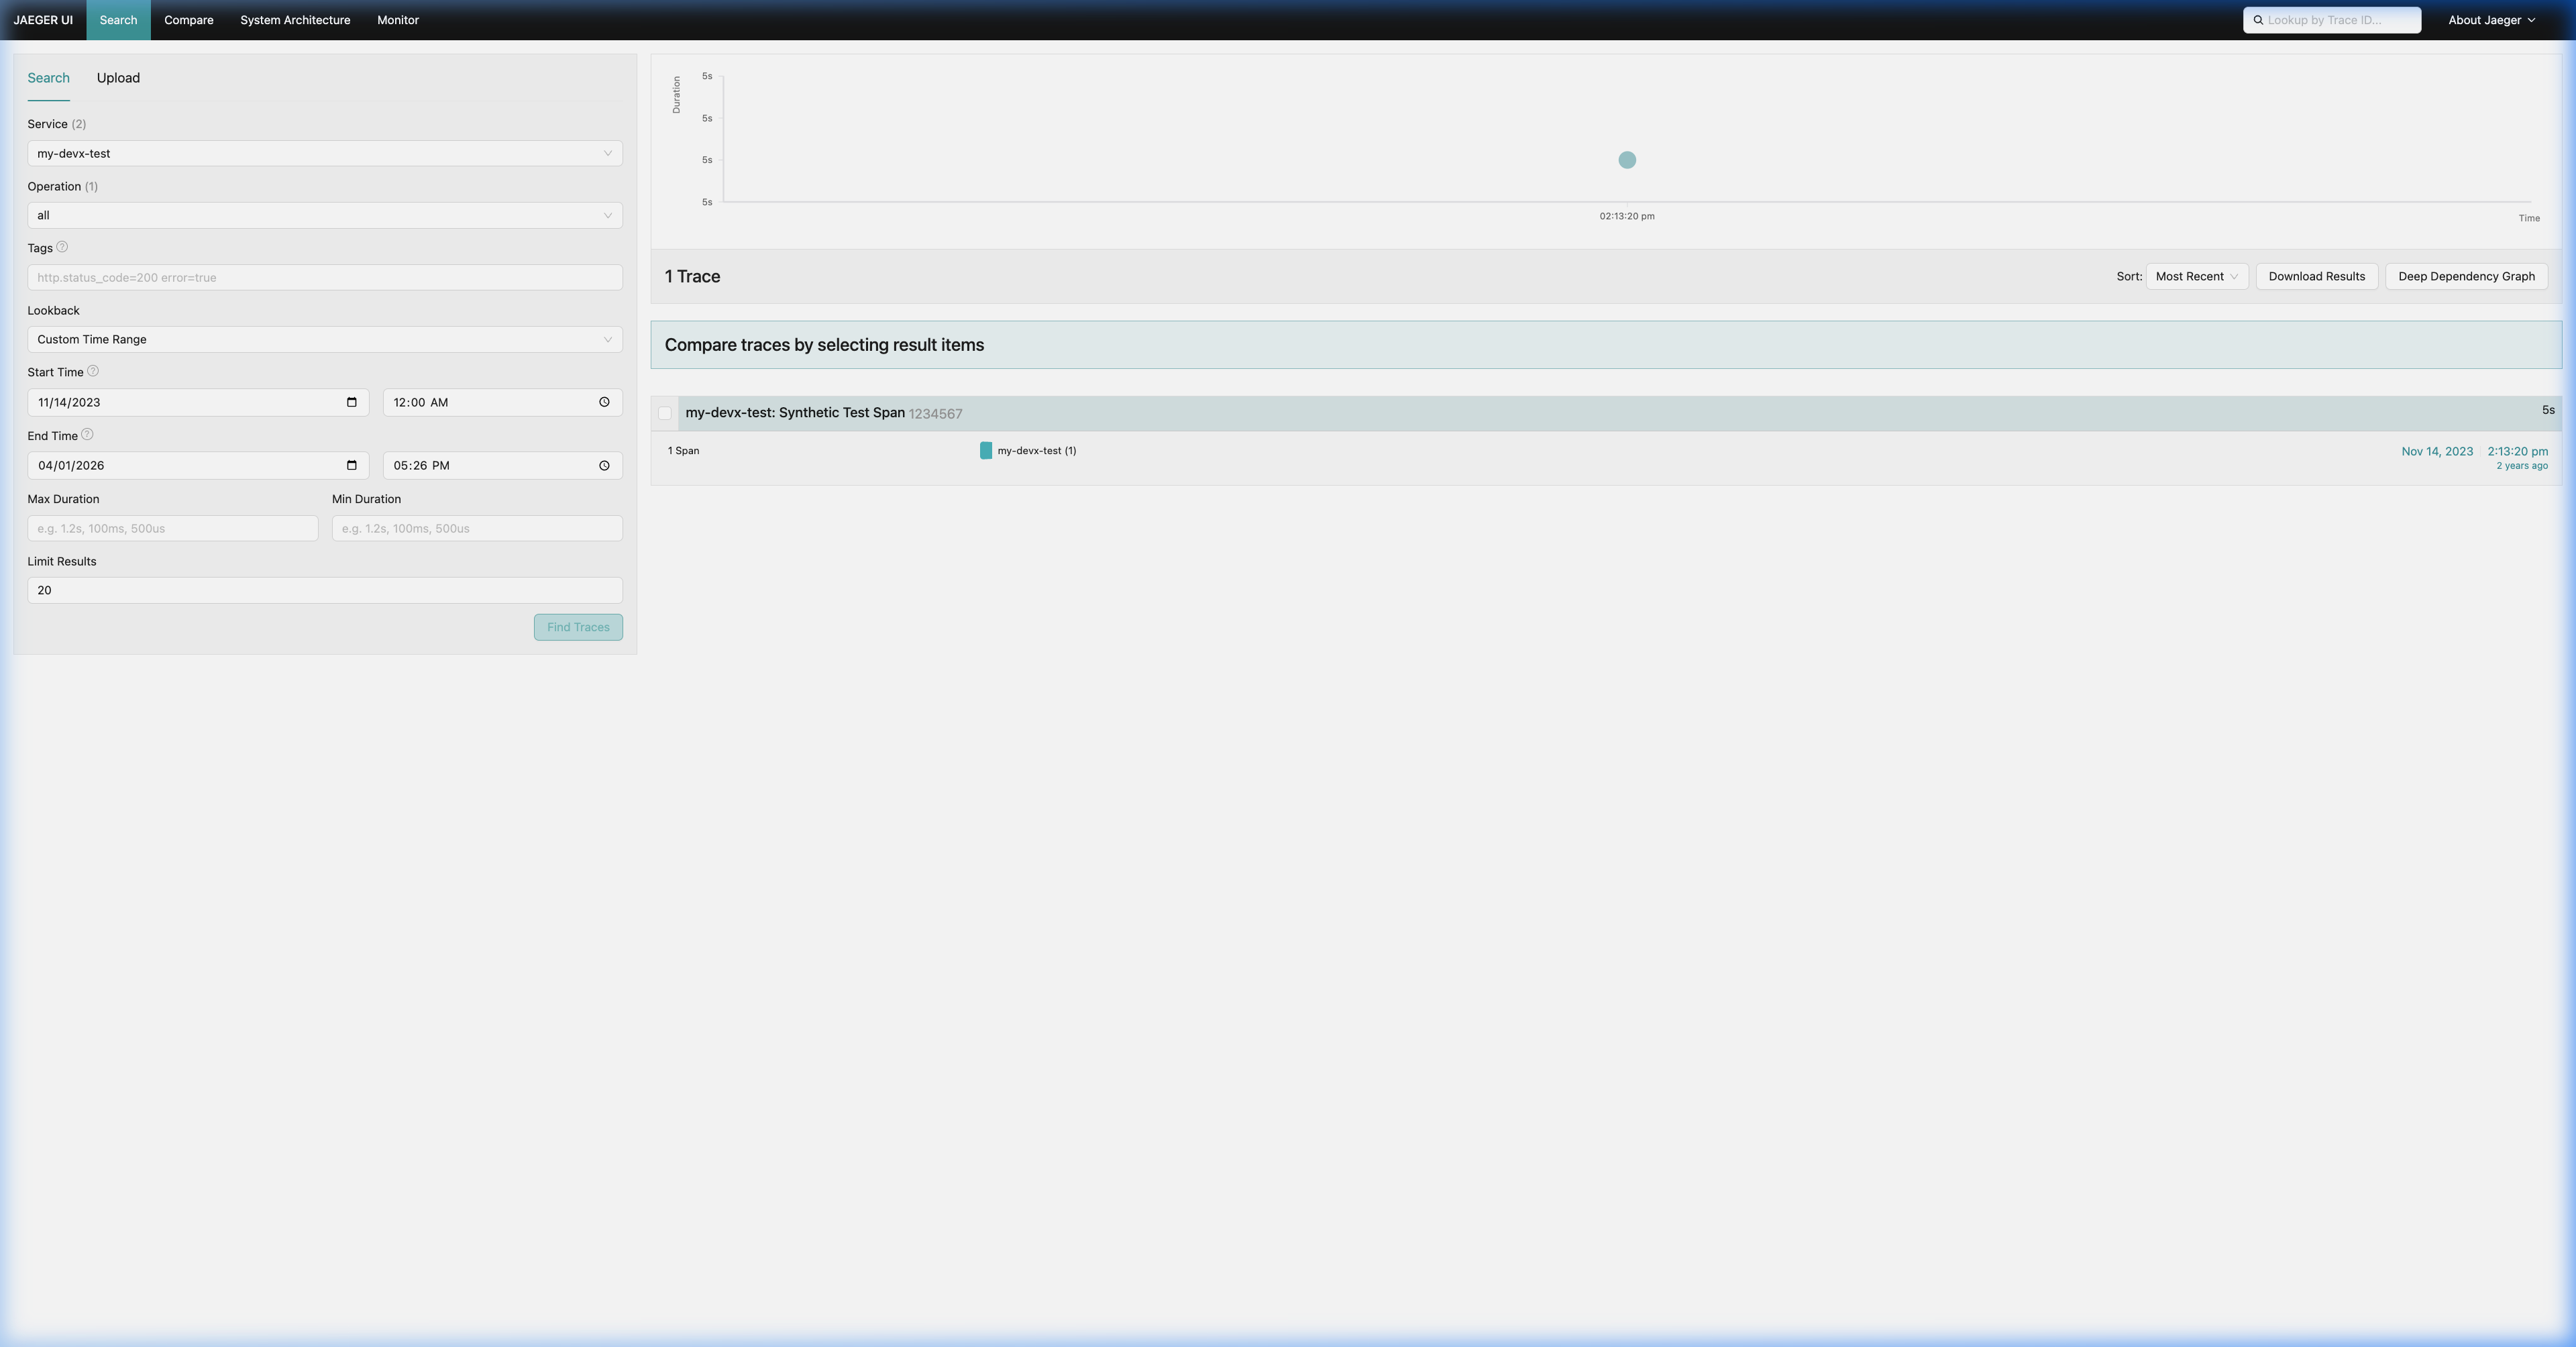
Jaeger
If you spawned jaeger, the UI is available at http://localhost:16686.
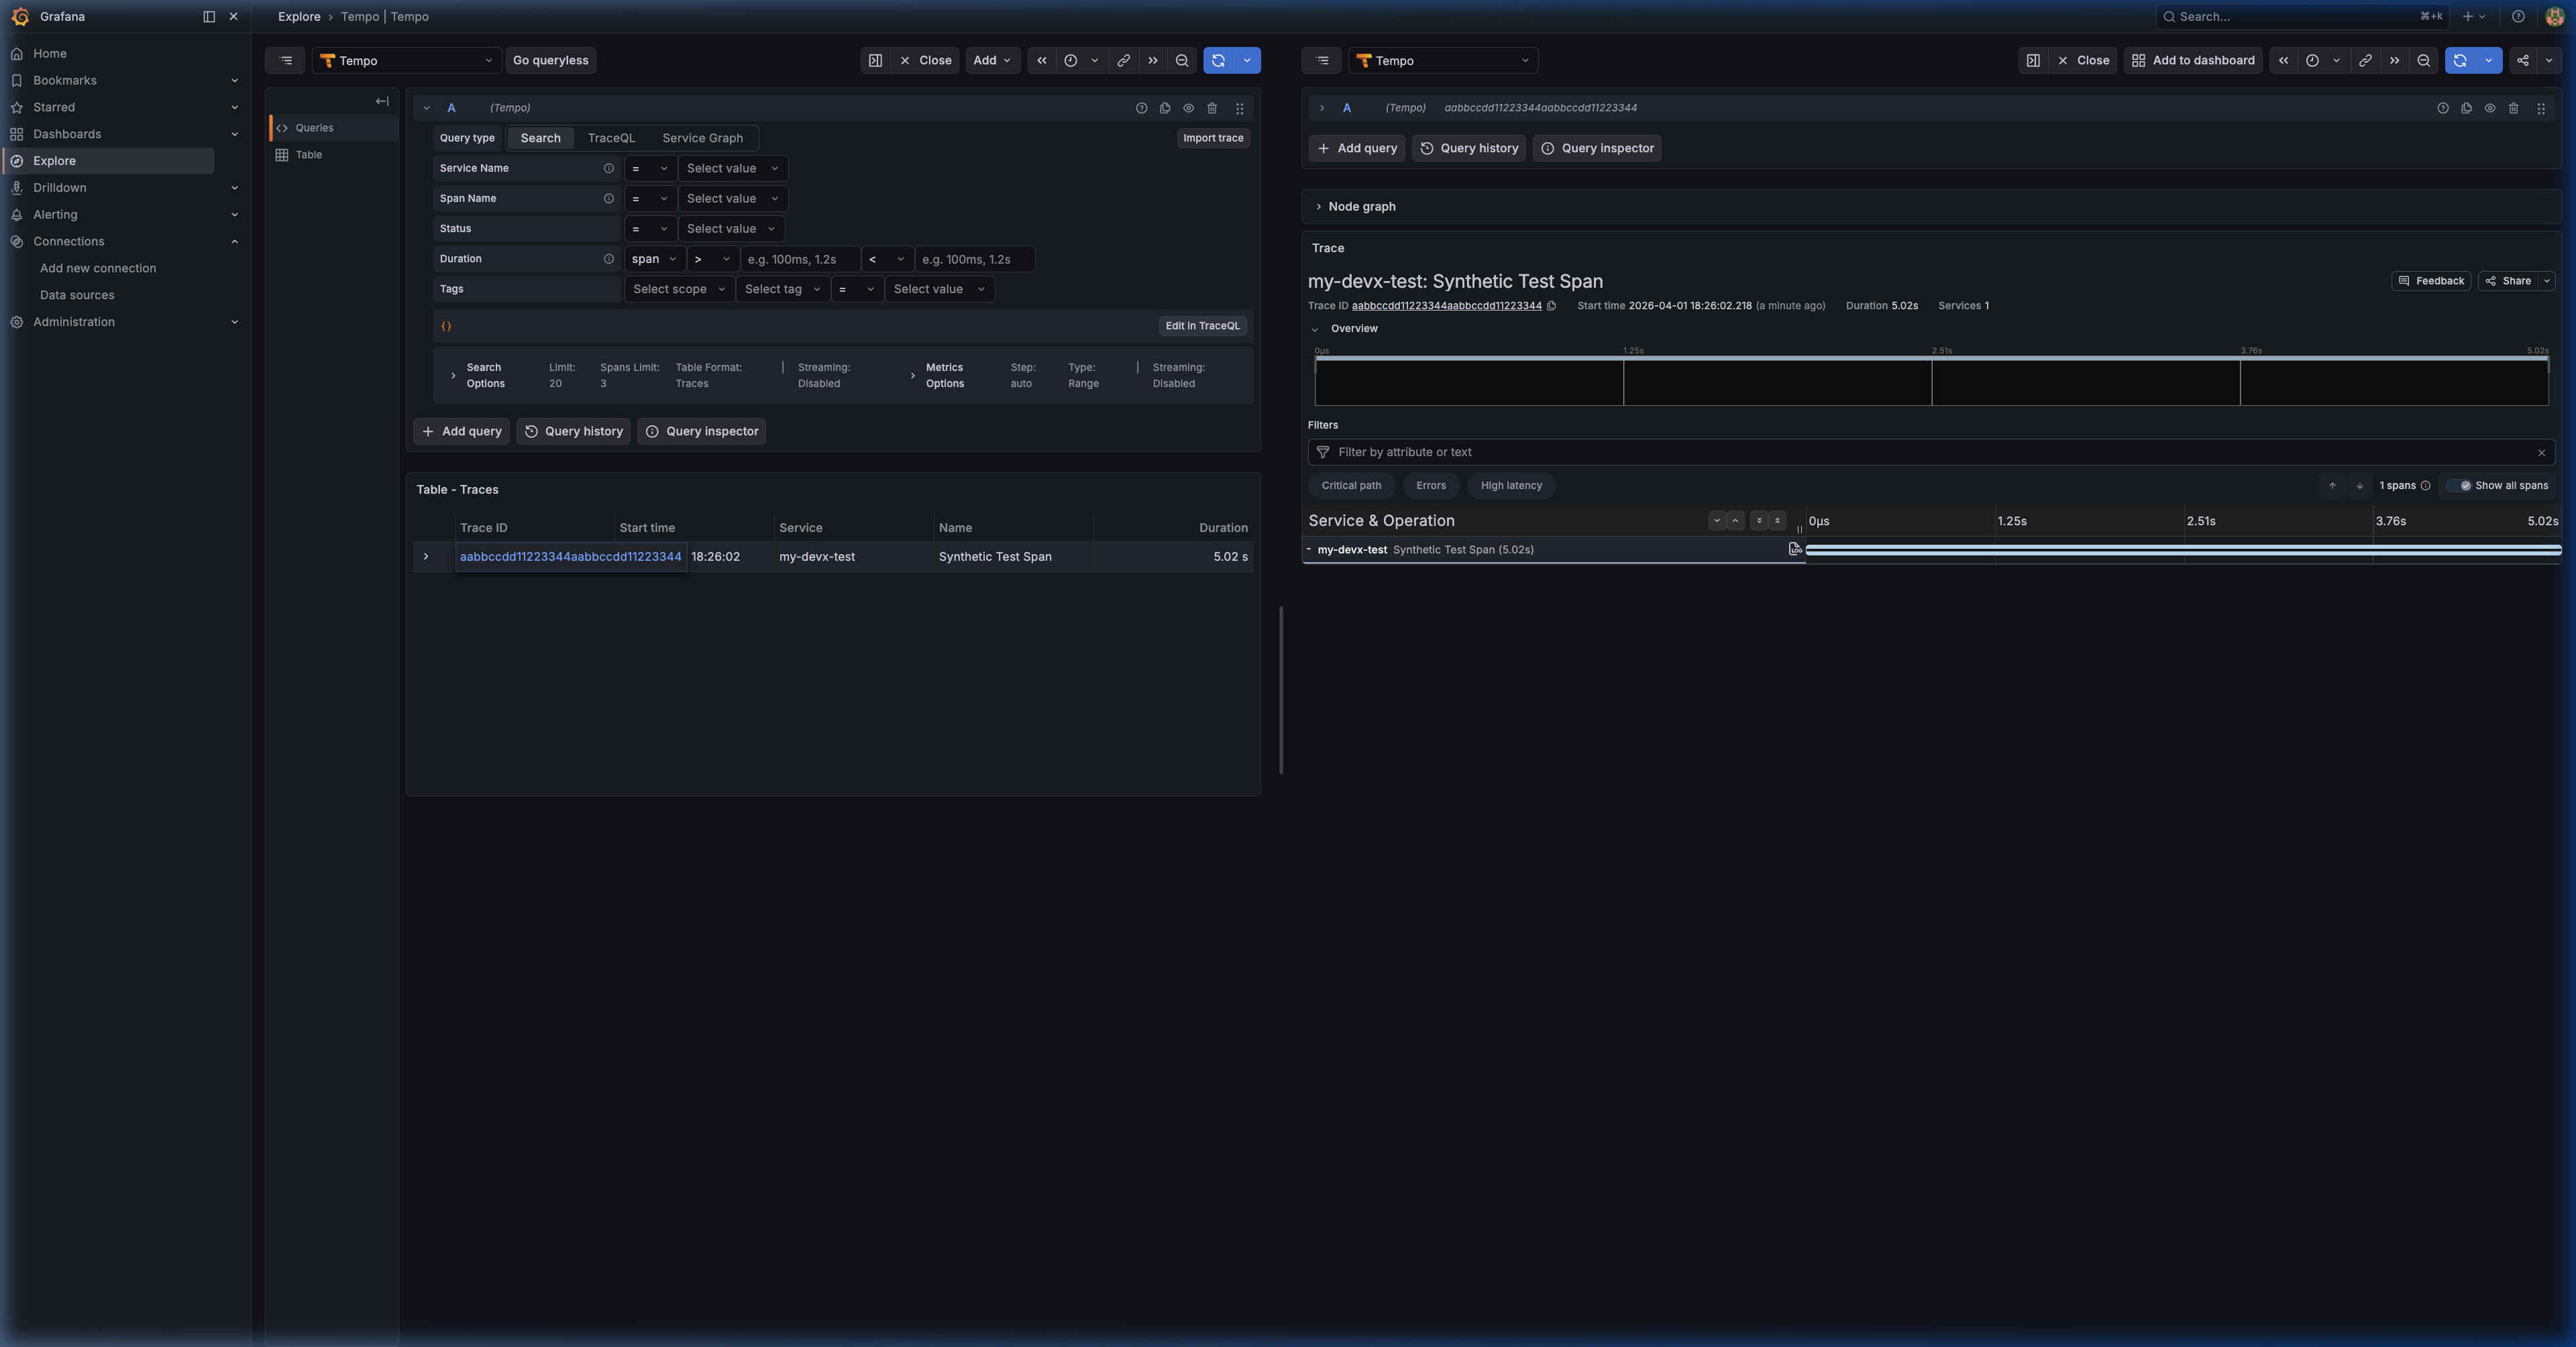
Grafana Tempo
If you spawned grafana, the UI is available at http://localhost:3100 (Default login: admin/admin).
To find your traces:
- Navigate to Explore (Compass icon) in the left sidebar.
- Select Tempo from the top data sources dropdown.
- Use the Search tab to view recent traces.
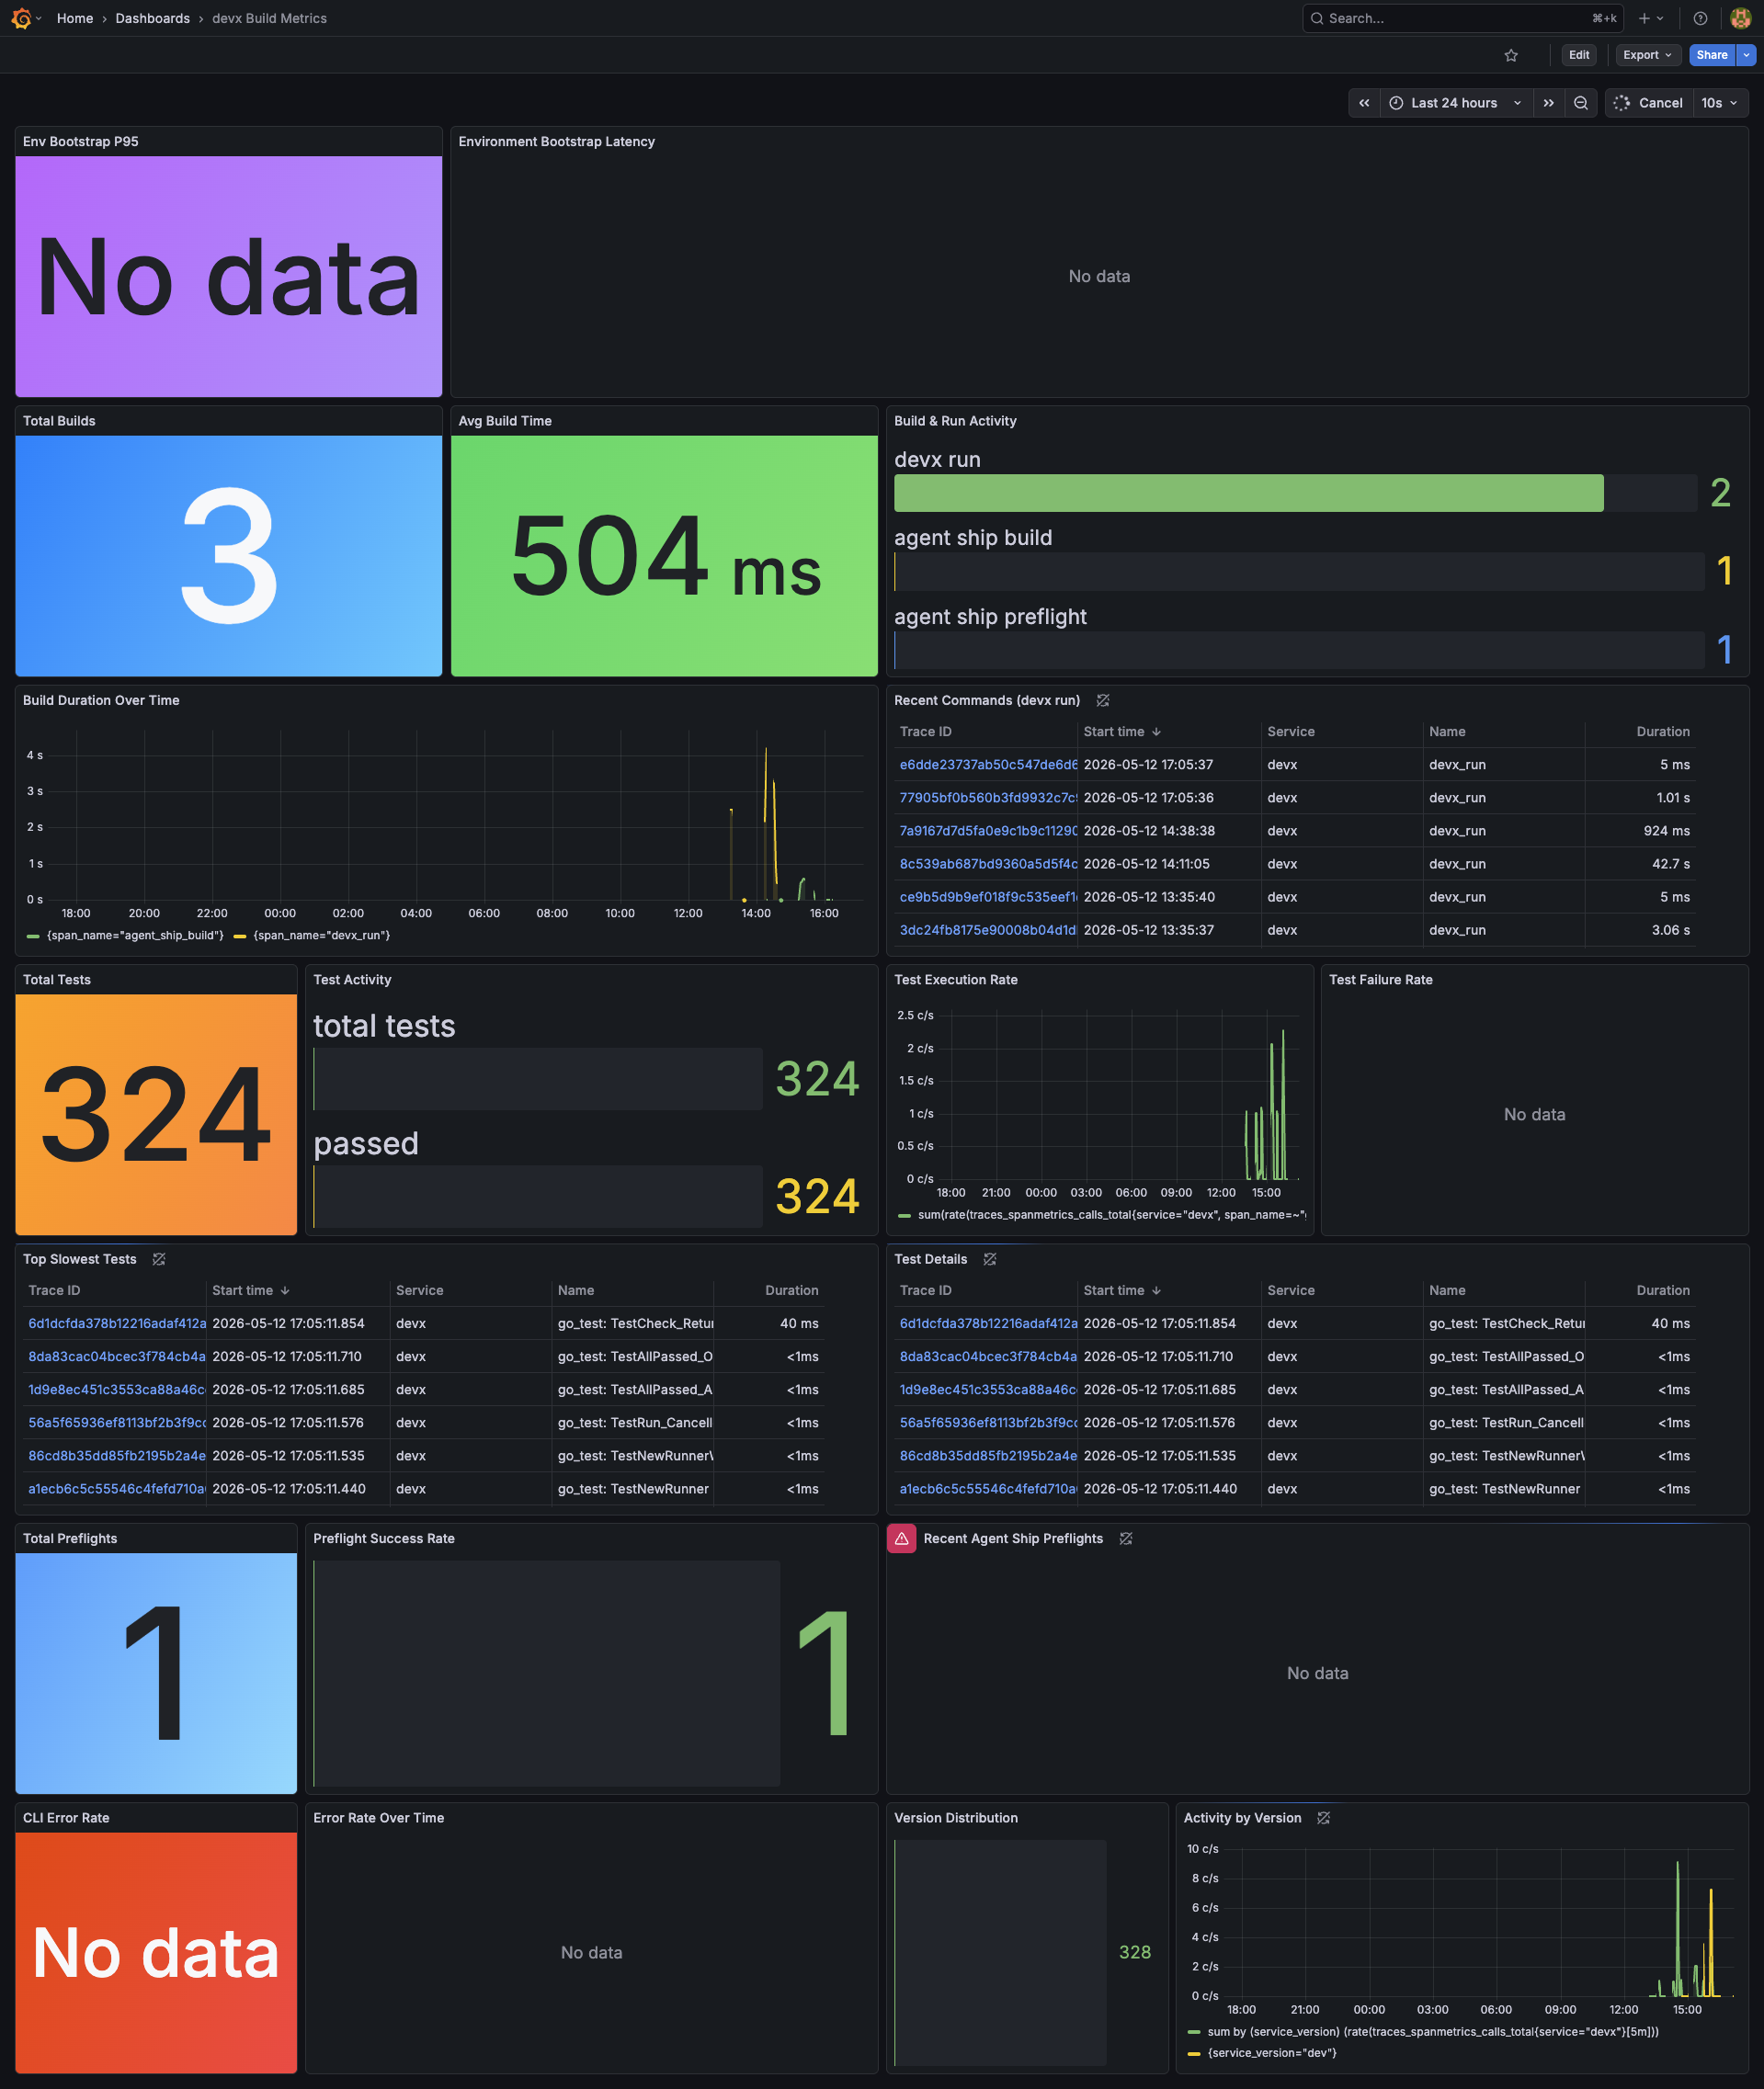
devx Build Metrics Dashboard
When you spawn the Grafana backend, devx automatically provisions a Build Metrics dashboard that visualizes your CI performance from devx agent ship:
devx trace spawn grafanaThe dashboard is accessible at http://localhost:3000/d/devx-build-metrics/devx-build-metrics and includes:
| Panel | Description |
|---|---|
| Total Builds | Count of all build events |
| P50/P90 Build Time | Percentile latency from Tempo spans |
| Build Duration Over Time | Time series showing build duration trends |
| Recent Agent Ship Preflights | Table with stack, branch, and pass/fail outcomes |
| Test Details | Table containing individual granular test spans (Go only) |
| Test/Lint/Build Results | Bar Gauges showing pass/fail/skip breakdown |
Dashboard Verification
Here is an automated verification of the Build Metrics dashboard in action:
Each devx agent ship and devx run execution exports an enriched span. devx agent ship pre-flights attach attributes like devx.stack, devx.branch, devx.test.pass, devx.lint.pass, and devx.build.pass. Furthermore, devx run -- go test emits individual test spans with devx.test.name and devx.test.status. All data is queryable directly in Tempo's TraceQL metrics explorer.
DOGFOODING
We use this dashboard ourselves during devx development — every commit to the devx CLI generates build metrics that we monitor to catch performance regressions.
Managing Backends
You can list running backends and remove them when finished:
# List all active telemetry engines
devx trace list

# Teardown the backend
devx trace rm jaeger